Why this inquiry matters
What this tool can—and cannot—tell you
It counts possible everyday AI touchpoints. It does not calculate your personal water, energy, or carbon footprint, and it cannot identify the exact data center that handled an individual request. Cloud routing changes constantly; some functions run on your device; a ZIP code is not a routing table.
Trace a public web path
Enter a domain to make a public DNS observation. The page queries a public DNS resolver from your browser and shows the current A/AAAA records. Then it gives you a dossier structure for following the path from domain to network to hosting evidence to community questions.
No lookup has been made.
Public-evidence trace dossier
- Origin lead: record reverse DNS, ASN/WHOIS registry, host support documentation, and the date of observation.
- Edge lead: separately record any CDN/WAF headers or DNS names. An edge location is not necessarily the origin.
- Facility lead: only name a building after a provider statement, contract, permit, or other attributable public record supports it.
- Ownership lead: look for assessor records, corporate filings, planning applications, and registered owner/LLC names.
- Community lead: find utility filings, water reports, zoning hearings, environmental permits, local reporting, and resident testimony.
Research questions: Who owns the concrete? Which grid and watershed support it? What public incentives or interconnection commitments exist? Which workers and neighbors can answer back?
Name the AI platforms you use
People often remember a chatbot but forget named AI tools embedded in search, office software, social media, browsers, and devices. Select any that you use.
Which kinds of AI touch your week?
Select only what applies. There are 32 everyday-practice prompts plus 7 named AI-platform prompts—not claims about you. The inventory is meant to surface background systems that are easy to miss.
Your AI-infrastructure reflection
Make the four questions interactive
Your notes stay in this browser page until it is closed or refreshed; they are not sent anywhere.
1. What function is involved?
Generation, prediction, ranking, recognition, recommendation, monitoring, or automation?
2. Where might it operate?
On-device, edge service, regional cloud, or undisclosed vendor infrastructure?
3. What does it depend on?
Whose work, data, time, electricity, water, land, or public resources are involved?
4. Who can answer?
Who is responsible for design, errors, data use, procurement, and material impacts?
Honest boundary: a selected service may use several providers or none of the providers shown here; provider relationships change; listed names are examples of likely infrastructure ecosystems, not a network trace. The tool intentionally makes no per-click electricity, water, carbon, or “number of data centers serving you” estimate.
Why count the system?
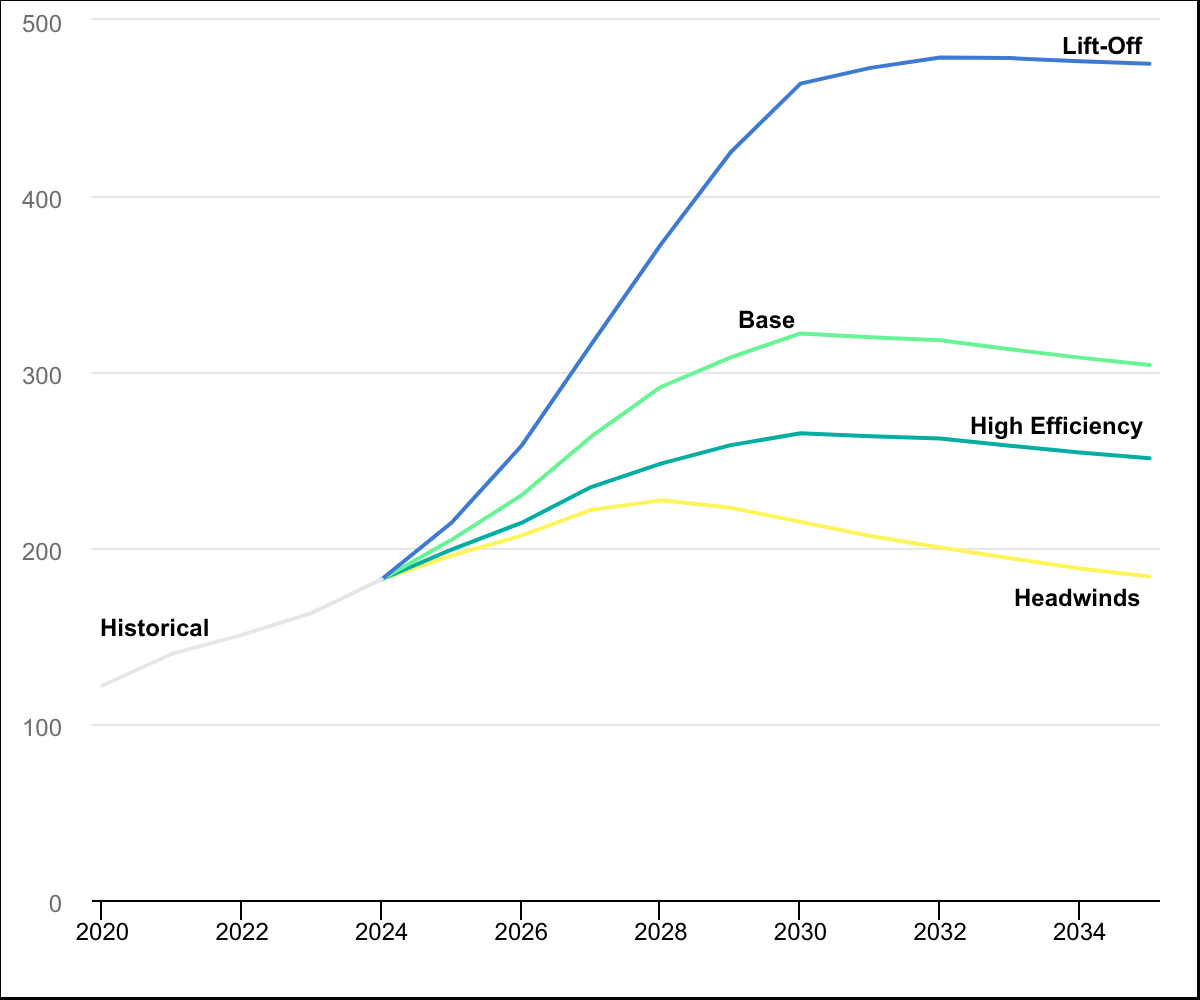
The International Energy Agency estimates that data centers used about 415 TWh of electricity in 2024 and projects rapid growth. Those are total data-center figures, not a personal bill for AI use. The relevant questions are distributed: infrastructure location, grid investment, water, labor, public incentives, and who gets to decide.